-
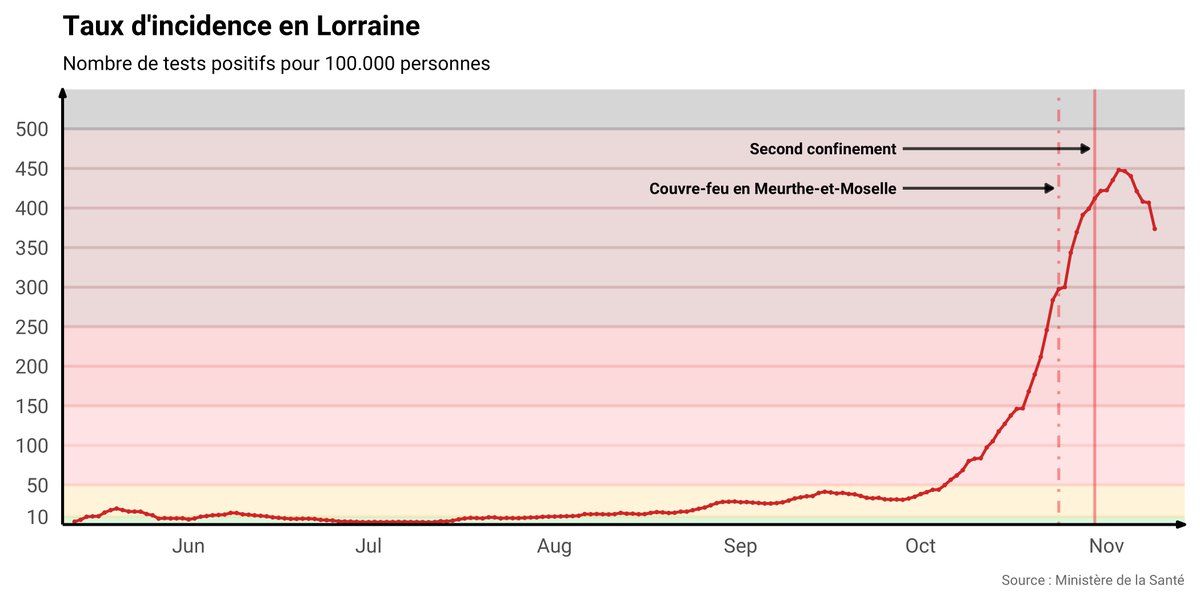
Incidence rate in Lorraine The 2nd lockdown is working but the real question is by how much? It’s a lighter one, so we’ll need time to see if the current rate of degrowth is sustained (If you’re interested, here’s my full dashboard: projects.aleryon.science/covid-19/)Permalink
 ❤️ 1 Favorite
Mood +2 🙂
❤️ 1 Favorite
Mood +2 🙂
-
And in case you’re wondering, the dashboard is 100% R: - flexdashboard with RMarkdown - ggplot2 for the plots - tidyverse Custom ggplot2 theme + customized CSS theme for the whole website And I wrote a shell script for automated-ish deployment on the server
❤️ 1 Favorite
Mood 0