-
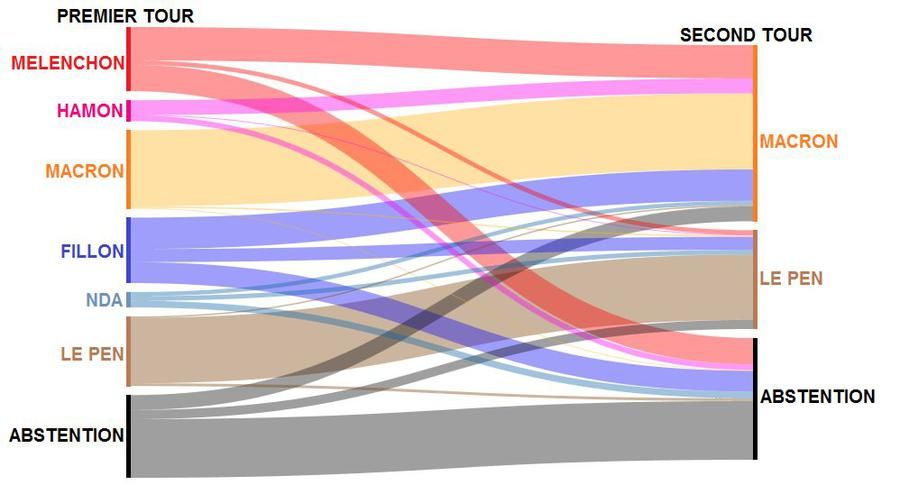
Hey #econtwitter! Does anyone know how this kind of graph is called? And if there is a R package to do something similar? Afaik, ggplot can't make them: github.com/rstudio/cheatsheets/blob/master/data-visualization-2.1.pdf Thanks!
 ♻️ 1 Retweets
❤️ 6 Favorites
Mood +4 🙂
♻️ 1 Retweets
❤️ 6 Favorites
Mood +4 🙂
-
It’s called alluvial diagrams, and there is a couple of answers about the R packages in the tweet’s answers @simardcasanova/1120998759830364160?s=21Permalink
❤️ 2 Favorites
Mood 0